KE Trade Nextview Chart Help
|
A. Technical Chart
- Overview
- Candlestick Bar
- Visual Settings (Modify Color)
- Select Symbol
- Search Symbol
- Adding Indicators
- Customize Indicator Toolbar
- Adding Drawing Tools
- Customize Drawing Tool color
B. Performance Chart
- Select Symbol
- Compare Symbols
- Remove Symbol
- Change Historical Period
C. Indicators
- Ichimoku Kinko Hyo
|
| A. Technical Chart |
| 1. Overview |
| |
| |
 |
Open performance chart. |
 |
Search symbol button. |
 |
Open / saving button. |
 |
Export chart to gif button. |
 |
Chart type (line, candlestick and OHLC bar). |
 |
Chart period (daily, 5 minutes... Etc). |
 |
Historical data (1 year, 3 years, 5 years... Etc). |
 |
Show / hide grid. |
 |
Pointer (pointer, crosshair, vertical/horizontal.) Cross hair pointer will display indicator value. |
 |
Show / hide ToolPanel in the right. |
 |
Select chart template. |
 |
Save template button.(user can save up to 3 template) |
 |
Add indicator button. |
 |
Add drawing button. |
 |
Print Button. |
 |
Help file button. |
 |
Scroll left / right button. |
 |
Zoom in / out button. |
 |
Reload chart button. |
|
| |
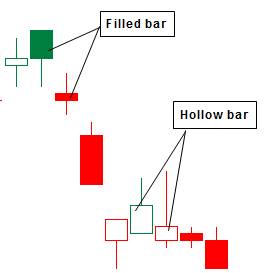
| 2. Candlestick Bar |
- How to read filled and hollow candlestick bar:
1. Filled Bar - Closing price of current bar is lower than Opening price of the current bar. (Close < Open)
2. Hollow Bar - Closing price of current bar is higher than Opening price of the current bar. (Close > Open)
- How to read color on candlestick bar:
1. Green Bar - Closing price for current bar is higher than previous bar closing price. (Current Close > Previous Close)
2. Red Bar - Closing price for current bar is lower than previous bar closing price. (Current Close < Previous Close)
|
| |
| |
| 3. Visual Settings (Modify Color) |
- On Settings tab, click on Font Size combo box and key in a different font size.
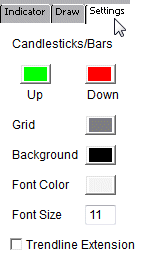
- Click on any color box to change font or background color.
|
| |
| |
| 4. Select Symbol |
- Click on any key to enable the Symbol Search Box (top left).
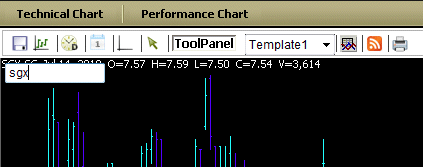
- Key in the symbol code and press Enter
|
| |
| |
| 5. Search Symbol |
- Click on Search button on main toolbar to open Search Stock window.
- Type in the stock name in Enter Stock combo box to start searching.
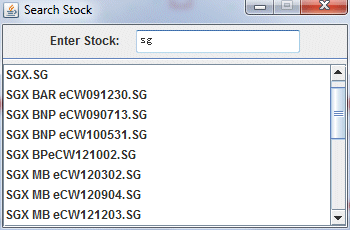
- Click on the symbol to open chart.
|
| |
| |
| 6. Adding Indicators |
- On Indicator tab, then click on the Add button.
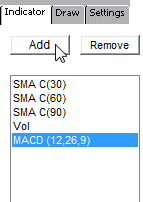
- Click on the indicator that you wish to add.
- Repeat steps a - b to add more indicators.
|
| |
| |
| 7. Customize Indicator Toolbar |
- On Indicators tab, select an indicator that you wish to modify.
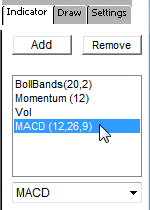
- Select the component that you wish to modify and make the necessary changes.
|
| |
| |
| 8. Adding Drawing Tools |
- On Draw tab, click on the drop down menu to select a drawing tool.
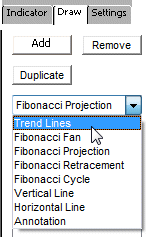
- Click Add and drag on chart to draw.
- To add another drawing tool, repeat steps a - b.
|
| |
| |
| 9. Customize Drawing Tool Color |
|
- On Draw tab, select the drawing tool that you wish to modify.
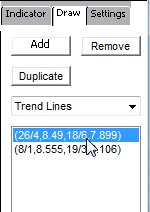
- Click the color box to change the color.
|
| |
| |
| B. Performance Chart |
1. Select Symbol |
- Click on any key to enable the Symbol Search Box (top left).
- Key in the symbol code and press Enter
|
| |
| |
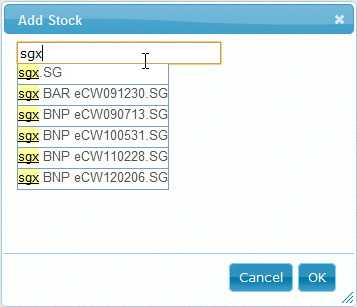
| 2. Compare Symbols |
- Click on the Compare button.
- Enter the symbol under the Add Stock window and click OK.
|
| |
| |
| 3. Remove Symbol |
- Move the pointer to the symbol that you wish to remove; the X button will appear.
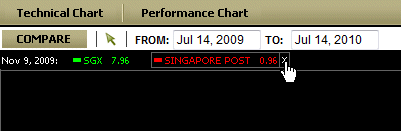
- Click on the X to remove the symbol.
|
| |
| |
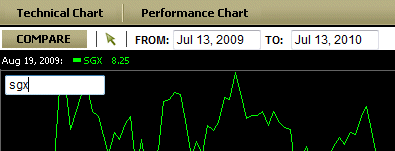
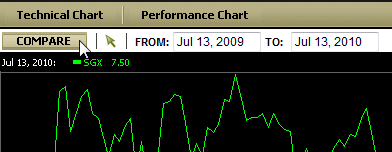
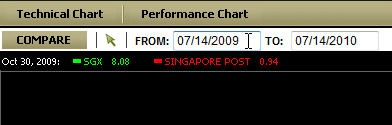
| 4. Change Historical Period |
- To change historical period, enter new date in From and To combo box respectively. (mm/dd/yyyy)
|