Ichimoku Kinko Hyo |
Ichimoku Kinko Hyo is a technical indicator that is used to gauge momentum along with future areas of support and resistance and works best on longer term timeframes, such as the daily and weekly. This indicator was developed so that users can gauge an asset's trend, momentum and support and resistance points without the need of any other technical indicator. |
| The Ichimoku indicator is comprised of five lines called tenkan-sen , kijun-sen , senkou span A , senkou span B and chickou span . The calculation for four of these lines involves taking only the midpoints of previous highs and lows, similar to moving average studies in which buy and sell signals are given with the crossover technique. |
Typically, the overall trend is up when the price is above kumo (cloud) , down when the price is below kumo, and flat when it is in the kumo itself. When a price is rising above the cloud, the trend is stronger, and when the kumo is descending it denotes a weaker trend. |
| Ichimoku Kinko Hyo as illustrated below: |
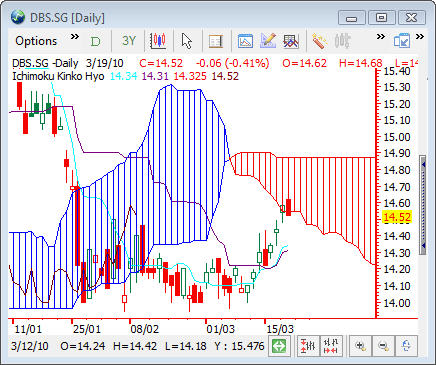 |